Prices at the DLA Increase More than 10%
HigherGov02/27/2023

HigherGov
Prices Increasing with Inflation
High inflation has had a significant impact across the economy including at government contractors and federal agencies. Since many government contracts and schedules have fixed prices over multiple years, inflation has had a more muted impact on prices than the broader economy thus far (though it has been a significant challenge for many contractors struggling with rising costs and an inability to increase prices charged to the government).
However, one area where price increases have had an immediate impact are on products acquired through the Defense Logistics Agency’s Internet Bid Board System (DIBBS), where the agency purchases millions of standardized products every year based on contractor bids.
Using HigherGov's database of historical prices of products acquired through DIBBS, we analyzed the prices of 100,000 NATO Stock Numbers (NSNs). As shown below, the average change in prices has been increasing gradually over the past decade and increased significantly along with inflation in 2021 and 2022.
Average Change in NSN Prices by Year
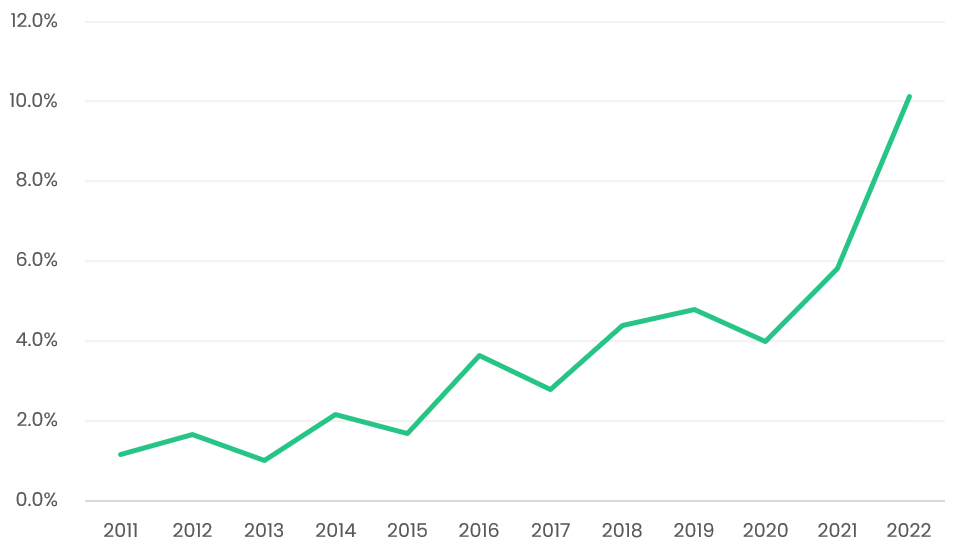 HigherGov Analysis
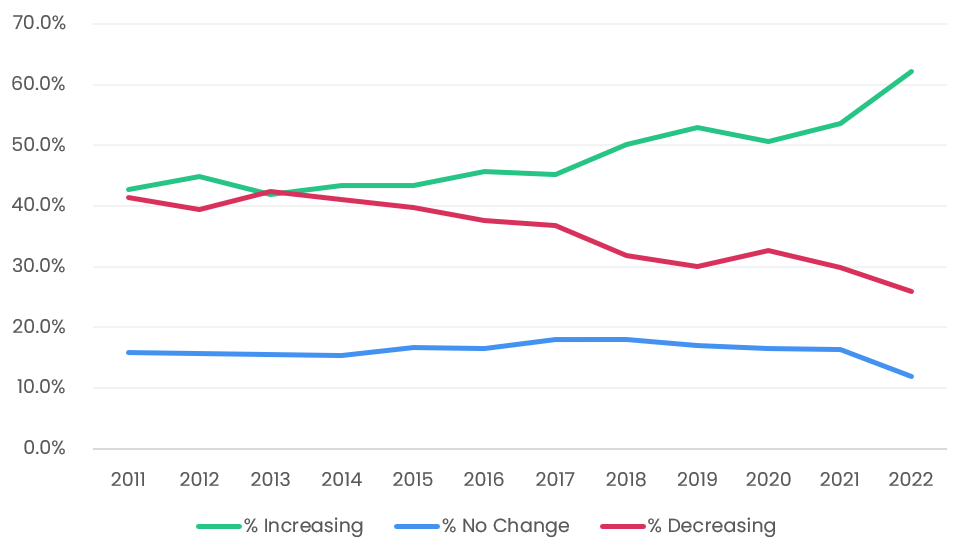
In addition, the percentage of NSNs experiencing price increases annually has gradually grown over the past decade with a further spike in 2022.
Percentage of NSNs with Increasing / Decreasing / Unchanged Prices
 HigherGov Analysis
However, there was a substantial variation in which products saw the largest price increases. The table below shows price increases in 2022 for select Federal Supply Groups / NATO Supply Groups. Of course, individual NSNs saw even wider variation, and it was not uncommon to see prices increasing 200%-300% for some NSNs.
2022 Average Change in Price for Select NSG/FSGs
| NSG/FSG | Description | % Increase |
| 73 | Food Preparation and Serving Equipment | 20.7% |
| 76 | Books, Maps, and Other Publications | 19.0% |
| 80 | Brushes, Paints, Sealers, and Adhesives | 18.7% |
| 81 | Containers, Packaging, and Packing Supplies | 18.0% |
| 42 | Fire Fighting, Rescue, and Safety Equipment; and Environmental Protection Equipment | 16.5% |
| 39 | Materials Handling Equipment | 15.8% |
| 40 | Rope, Cable, Chain, and Fittings | 15.5% |
| 12 | Fire Control Equipment | 15.2% |
| 17 | Aircraft Launching, Landing, and Ground Handling Equipment | 14.2% |
| 26 | Tires and Tubes | 14.0% |
| 30 | Mechanical Power Transmission Equipment | 13.4% |
| 84 | Clothing, Individual Equipment, and Insignia | 13.4% |
| 10 | Weapons | 12.8% |
| 25 | Vehicular Equipment Components | 12.8% |
| 63 | Alarm, Signal and Security Detection Systems | 11.9% |
| 44 | Furnace, Steam Plant, and Drying Equipment; and Nuclear Reactors | 11.9% |
| 93 | Nonmetallic Fabricated Materials | 11.9% |
| 20 | Ship and Marine Equipment | 11.7% |
| 49 | Maintenance and Repair Shop Equipment | 11.6% |
| 31 | Bearings | 11.1% |
| 28 | Engines, Turbines, and Components | 11.0% |
| 45 | Plumbing, Heating, and Waste Disposal Equipment | 10.8% |
| 29 | Engine Accessories | 10.8% |
| 62 | Lighting Fixtures and Lamps | 10.7% |
| 61 | Electric Wire, and Power and Distribution Equipment | 10.3% |
| 59 | Electrical and Electronic Equipment Components | 10.3% |
| 48 | Valves | 10.2% |
| 47 | Pipe, Tubing, Hose, and Fittings | 10.1% |
| 41 | Refrigeration, Air Conditioning, and Air Circulating Equipment | 10.1% |
| 34 | Metalworking Machinery | 10.0% |
| 66 | Instruments and Laboratory Equipment | 9.5% |
| 43 | Pumps and Compressors | 9.3% |
| 14 | Guided Missiles | 9.3% |
| 53 | Hardware and Abrasives | 8.9% |
| 58 | Communication, Detection, and Coherent Radiation Equipment | 8.7% |
| 70 | Automatic Data Processing Equipment, Software, Supplies and Support Equipment | 8.6% |
| 16 | Aircraft Components and Accessories | 8.4% |
| 51 | Hand Tools | 7.5% |
| 15 | Aircraft and Airframe Structural Components | 6.5% |
| 95 | Metal Bars, Sheets, and Shapes | 5.2% |
| 65 | Medical, Dental, and Veterinary Equipment and Supplies | 4.7% |
| 60 | Fiber Optics Materials, Components, Assemblies, and Accessories | 2.4% |
| 83 | Textiles, Leather, Furs, Apparel and Shoe Findings, Tents and Flags | 1.8% |
We anticipate that the rate of price increases will decrease over the following year as the pressures driving inflation subside and higher interest rates begin to moderate inflation. HigherGov will continue to monitor prices and provide a mid-year update.
Author
Justin Siken
Founder of HigherGov
justin.siken@highergov.com
LinkedIn
Notes on Methodology
Analysis includes 100,000 NSNs and over 1,000,000 price points. Excludes prices for any purchases made via an Automated Indefinite Delivery Contract (AIDC). An average was calculated for all known prices for a given year and price changes were analyzed on a per-NSN basis for years where purchases were made in two consecutive years. In calculating the average price change, the change in any individual NSNs was capped at 100%.
Data Sources
HigherGov Analysis, DIBBS
About HigherGov
HigherGov provides comprehensive government contracting and grant market intelligence for contractors, grant recipients, and their advisors.